Table of Contents
Divis Lab Business Overview
Divis Laboratories Ltd manufactures and exports APIs, Intermediates, and Nutraceutical ingredients.
Divis Lab Financial Performance
| FY 2022 | FY 2023 | FY 2024 | |
|---|---|---|---|
| Revenue | 8,960 | 7,767 | 7,845 |
| Expense | 5,075 | 5,397 | 5,635 |
| OPM (%) | 43% | 31% | 28% |
| Net income | 2,960 | 1,824 | 1,600 |
| EPS | 111.52 | 68.71 | 60.27 |
Divis Lab Financial Ratios
| PE Ratio | ROCE | ROE | PEG Ratio |
| 86.4 | 16.5 % | 12.2 % | 25.1 |
| Book Value | ROA | Debt to equity | Piotroski score |
| ₹ 511 | 10.7 % | 0.00 | 5.00 |
Divis Lab Shareholding Pattern
| Mar 2022 | Mar 2023 | Mar 2024 | |
|---|---|---|---|
| Promoters | 51.94% | 51.94% | 51.92% |
| FIIs | 18.45% | 14.67% | 14.68% |
| DIIs | 18.32% | 21.00% | 22.10% |
| Public | 11.28% | 12.31% | 11.19% |
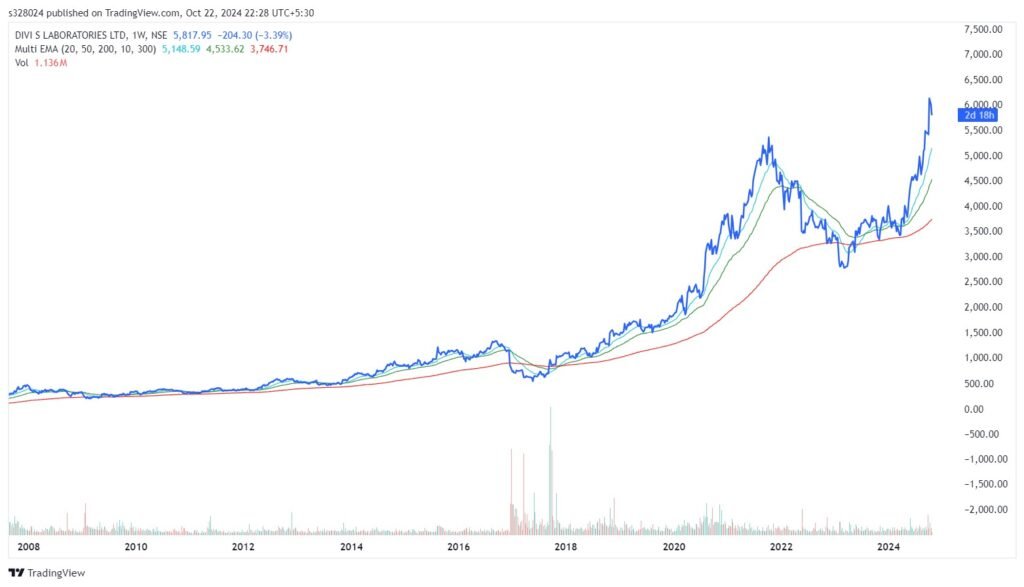
Divis Lab Stock Price Performance
Divis Lab Peer comparison
| PE ratio | ROCE % | OPM % | |
|---|---|---|---|
| Divis Lab | 86.44 | 16.48 | 28.36 |
| Jubilant Pharmova | 82.06 | 6.74 | 14.35 |
| Neuland Lab | 51.12 | 33.26 | 29.91 |
Indian Stock market has grown over the last couple of decades. However, little has gone towards bolstering the participation of retail investors in the market. Through its unbiased approach of dissecting the prevalent challenges and finding ways for small investors to make money, Stock Market Dekho aims to help individual investors along their stock market journey.
Disclaimer: No content on this website should be treated as investment advice. All the content offered on the website is for informational purposes only. Please contact your adviser before making an investment.
Contact Us:- admin@stockmarketdekho.in
Pages
Follow us
Proudly powered by WordPress