Table of Contents
Apollo Hospitals Business Overview
Apollo Hospitals was established in 1983 by Dr. Prathap C Reddy, a renowned architect of modern healthcare in India. As the nation’s first corporate hospital, Apollo Hospitals is acclaimed for pioneering the private healthcare revolution in the country.
Apollo Hospitals has emerged as Asia’s foremost integrated healthcare services provider and has a robust presence across the healthcare ecosystem, including Hospitals, Pharmacies, Primary Care & Diagnostic Clinics, and several Retail Health models.
Apollo Hospitals
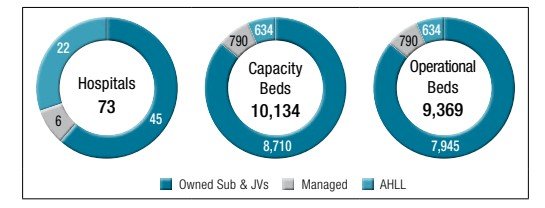
As of March 31, 2024, Apollo had a capacity of 10,134 beds in 73 hospitals located in India and overseas. Of the 10,134 beds, 8,710 beds are located in 45 owned hospitals, 363 beds in 11 cradles, 271 beds in 11 daycare/ short surgical stay centers, and 790 beds are in 6 hospitals under our management through operations and management contracts.
Apollo Pharmacy
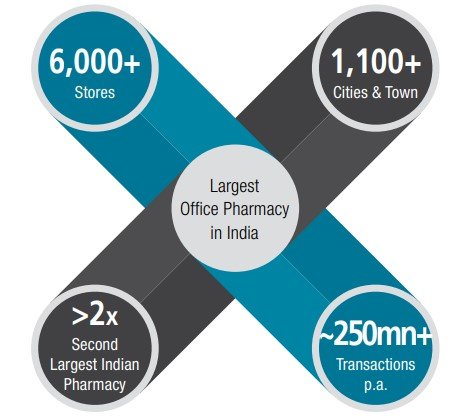
Apollo Pharmacy stands as India’s premier organized and branded retail pharmacy network, Aligned with Apollo Hospitals, Apollo Pharmacy has expanded its offerings to include a diverse range of wellness products.
Let’s Check out Apollo’s quick SWOT Analysis
Strengths
➢ Strong Brand Positioning
➢ Dominant PAN-India Presence
➢ Integrated Medical Offerings
➢ Extensive Technological expertise
Weaknesses
➢ Heavy Regulatory requirements
➢ Capital Intensive Industry
➢ Dissimilar Markets
➢ Shortage of skilled medical professionals
Opportunities
➢ Digital Healthcare Advancements
➢ Changing Healthcare Delivery Formats
➢ Preventive Health and Wellness
➢ Medical Value Travel
Threats
➢ Highly regulated industry
➢ High cost of resources
➢ High Competition
➢ Skilled Manpower Shortage
Check Out: Trade Together, a Flagship program
Apollo Hospitals Financial Performance
Whatever visionary story a company tells, if it’s not generating cash it is like building castles in the air. Let’s check out Apollo Hospitals’s last 3 years’ Financials trends.
| FY 2022 | FY 2023 | FY 2024 | |
|---|---|---|---|
| Revenue | 14,663 | 16,612 | 19,059 |
| Expense | 12,474 | 14,548 | 16,668 |
| OPM (%) | 15% | 12% | 13% |
| Net income | 1,108 | 844 | 935 |
| EPS | 73.42 | 56.97 | 62.50 |
Apollo Hospitals Financial Ratios
| PE Ratio | ROCE | ROE | PEG Ratio |
| 98.3 | 15.6 % | 17.7 % | 2.81 |
| Book Value | ROA | Debt to equity | Piotroski score |
| ₹482 | 5.99 % | 0.77 | 6.00 |
Apollo Hospitals Shareholding Pattern
| Mar 2022 | Mar 2023 | Mar 2024 | |
|---|---|---|---|
| Promoters | 29.33% | 29.33% | 29.33% |
| FIIs | 50.81% | 46.96% | 45.63% |
| DIIs | 12.93% | 17.76% | 19.55% |
| Public | 6.70% | 5.72% | 5.26% |
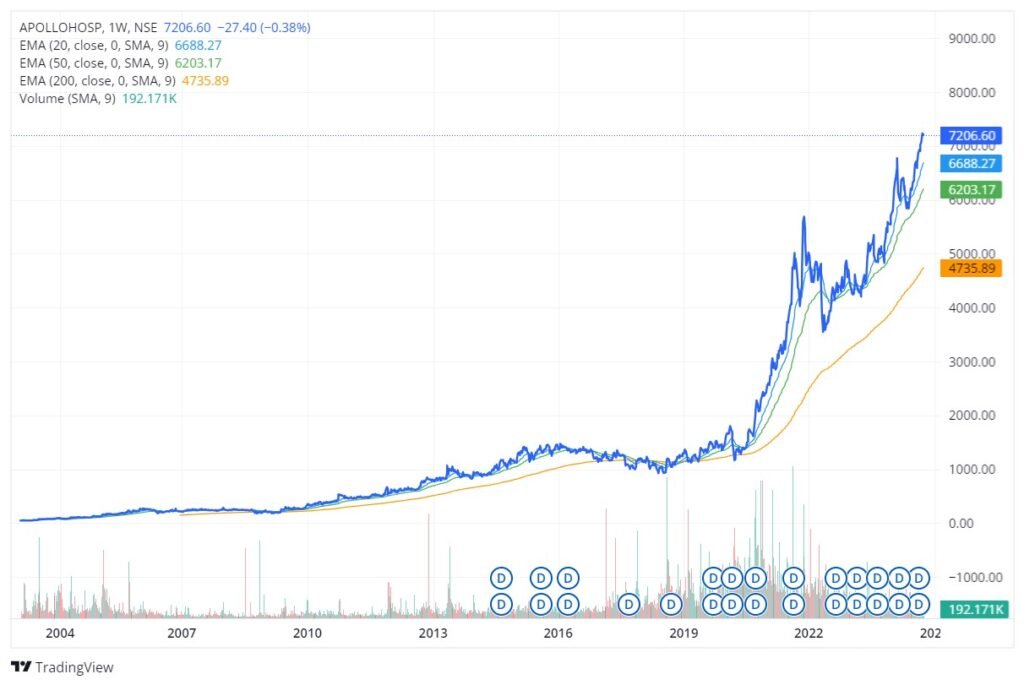
Apollo Hospitals Stock Price Performance
Check out Apollo Hospitals’s historical Stock price performance.
Apollo Hospitals Peer comparison
| PE ratio | ROCE % | OPM % | |
|---|---|---|---|
| Apollo Hospitals | 98.30 | 15.55 | 12.96 |
| Max Healthcare | 98.52 | 16.00 | 27.23 |
| Fortis Healthcare | 71.24 | 10.34 | 18.86 |
| Global Health | 61.92 | 19.32 | 23.71 |
Indian Stock market has grown over the last couple of decades. However, little has gone towards bolstering the participation of retail investors in the market. Through its unbiased approach of dissecting the prevalent challenges and finding ways for small investors to make money, Stock Market Dekho aims to help individual investors along their stock market journey.
Disclaimer: No content on this website should be treated as investment advice. All the content offered on the website is for informational purposes only. Please contact your adviser before making an investment.
Contact Us:- admin@stockmarketdekho.in
Pages
Follow us
Proudly powered by WordPress