Table of Contents
Punjab National Bank Business Overview
Punjab National Bank is India’s first Swadeshi Bank. PNB is a Banking and Financial service bank owned by the Government of India, headquartered in New Delhi, India. It is now the 2nd largest PSU Bank in India with a Business of INR 24.36 lakh Crores.
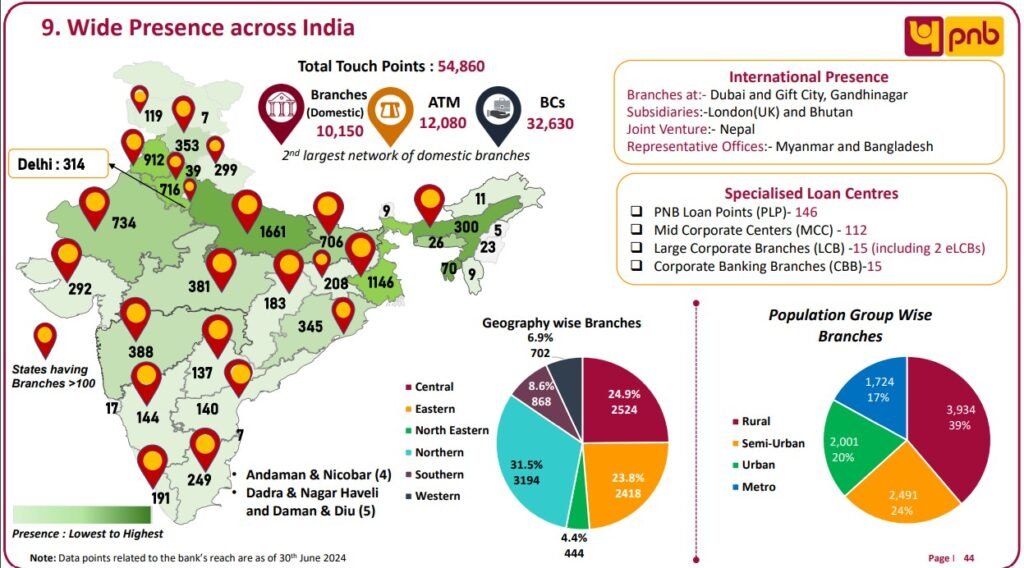
Following the merger with the Oriental Bank of Commerce and the United Bank of India, Punjab National Bank (PNB) significantly expanded its geographical footprint, broadened its customer base, and substantially increased its asset base. Before the above amalgamation, Hindustan Commercial Bank, New Bank of India, and Nedungadi Bank were merged with Punjab National Bank. PNB has 2nd Largest Domestic Branch Network, 39% of branches are in rural areas and 24% are in semi-urban.
Punjab National Bank Key Highlights
➢Ratios
PCR – 94.28%
GNPA – 6.24%
NNPA – 0.96%
CASA Ratio – 42.47%
➢Branch Network
Total Touch Points:- 54,860
Branches (Domestic): 10,150
ATM:12,080
BCs: 32,630
➢ Customer Base
The bank has a base of 18cr.+ Customers post the merger
➢ International Footprints
Branches:- Dubai and Gift City, Gandhinagar
Subsidiaries:-London(UK) and Bhutan
JV:- Nepal
Representative Offices:- Myanmar and Bangladesh
Key Growth Strategies
1. Credit Growth
❖Targets to increase RAM Share in overall advanced portfolio
❖Targeted areas for credit growth e.g. Sunrise Sectors, Infrastructure Sector, and other Key industries
❖ Leveraging subsidiaries like PNBCSL & PNBISL
❖ Strategic Co-lending partnership models
2. Deposit and Customer Base
❖ Imbibing and improving customer service culture
❖ Leveraging Non-Traditional Digital Channels
❖ Fintech partnerships: Embedded Banking for deepening reach of financial products
❖ Specialized offerings i.e. Wealth Management and Customized Banking Services
PNB Financial Performance
| FY 2022 | FY 2023 | FY 2024 | |
| Revenue | 76,242 | 86,845 | 109,065 |
| Expense | 36,026 | 41,502 | 39,623 |
| FM (%) | -9% | -7% | 1% |
| Net income | 3,908 | 3,359 | 9,157 |
| EPS | 3.51 | 3.04 | 8.27 |
PNB Key Financial Ratios
| ROCE | PE Ratio | ROE | PEG Ratio |
| 5.46 % | 10.2 | 8.54 % | 0.42 |
| Book Value | ROA | Debt to equity | Piotroski score |
| ₹ 100 | 1.99 % | 13.2 | 6.00 |
PNB Shareholding Pattern
| Mar 2022 | Mar 2023 | Mar 2024 | |
|---|---|---|---|
| Promotors | 73.15% | 73.15% | 73.15% |
| FIIs | 1.36% | 1.71% | 4.82% |
| DIIs | 11.60% | 13.53% | 12.37% |
| Public | 13.89% | 11.61% | 9.67% |
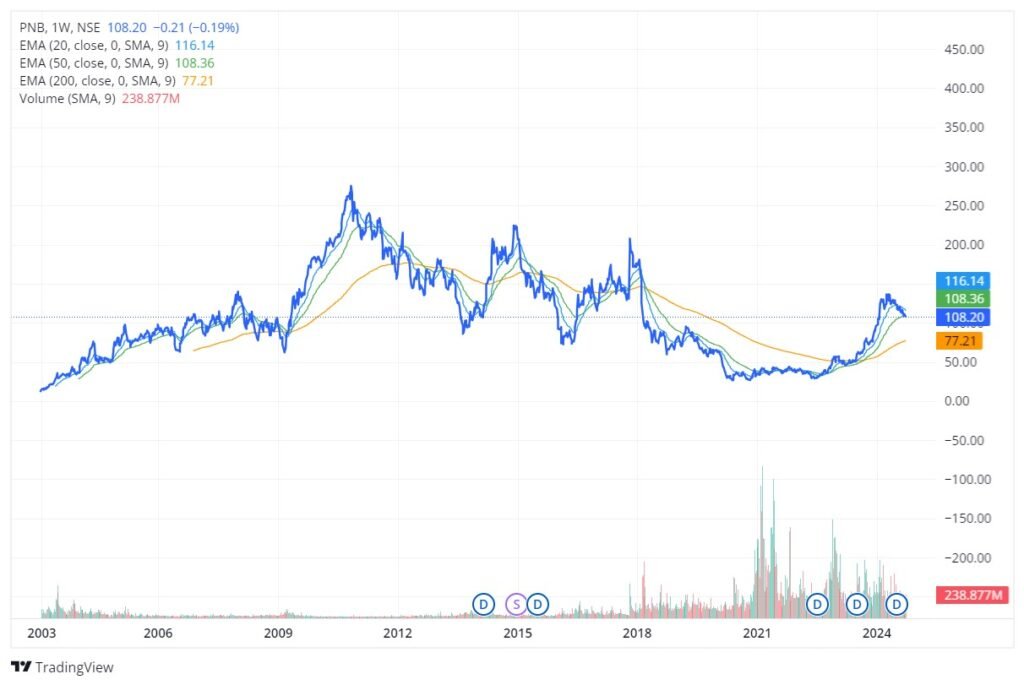
PNB Price Chart
Punjab National Bank Peer comparison
| PE ratio | ROCE % | OPM % | |
| PNB | 10.2 | 5.46 % | 47.05 |
| HDFC Bank | 18.33 | 7.67 | 33.60 |
| ICICI Bank | 18.33 | 7.60 | 34.44 |
| Axis Bank | 13.72 | 7.06 | 62.96 |
| Kotak Bank | 19.00 | 7.86 | 15.88 |
| IndusInd Bank | 12.41 | 7.93 | 60.48 |
| IDBI BANK | 15.05 | 6.23 | 68.52 |
| YES Bank | 49.60 | 5.83 | 58.49 |
Disclaimer: No content on this website should be treated as investment advice. All the content offered on the website is for informational purposes only. Please contact your adviser before making an investment.
Indian Stock market has grown over the last couple of decades. However, little has gone towards bolstering the participation of retail investors in the market. Through its unbiased approach of dissecting the prevalent challenges and finding ways for small investors to make money in the market, Stock Market Dekho aims to help individual investors along their stock market journey.
Disclaimer: No content on this website should be treated as investment advice. All the content offered on the website is for informational purposes only. Please contact your adviser before making an investment.
Contact Us:- admin@stockmarketdekho.in
Follow us
Proudly powered by WordPress